I have done a project to foresee the future of contamination, in my case I have done it for Badalona and I have only done it for pollutant no2. The project project, as I said before, consists of foreseeing the future, but the real objective is to see how effective the forecasting is. To do the project I did two methods, first the prophet method, which is longer than the other one I did, which is autoarima.
Once the libraries are installed I use the following instructions:
These instructions gave us the forecast from 01/01/2023 to 01/31/2023. After doing these instructions, I downloaded the data for the dates mentioned above from the internet to be able to compare the data and see how accurate it was.
To check the data, I took the column "yhat" and the date from the forecast, and from the current one (that's what I called my data taken from the database) I took the "y". Once the data was collected, with the forecast library I calculated the ME, RMSE, MAE, MPE,MAPE with the accuracy instruction.These metrics help assess the performance and accuracy of forecast models, providing insights into how well the predictions align with the actual values. Each metric has its own strengths and weaknesses, and it's important to consider them collectively to get a comprehensive understanding of the forecast accuracy.
ME (Mean Error): It represents the average difference between the predicted values and the actual values. A positive ME indicates an overall overestimation, while a negative ME indicates an overall underestimation.
RMSE (Root Mean Squared Error): It measures the square root of the average of the squared differences between the predicted values and the actual values. RMSE provides a measure of the average magnitude of the forecast errors, with a smaller value indicating better accuracy.MAE (Mean Absolute Error): It represents the average of the absolute differences between the predicted values and the actual values. MAE provides an average measure of the magnitude of the forecast errors, without considering their direction.
MPE (Mean Percentage Error): It calculates the average percentage difference between the predicted values and the actual values. MPE is a relative measure that indicates the magnitude of the errors as a percentage of the actual values. A positive MPE indicates an overall overestimation, while a negative MPE indicates an overall underestimation.
MAPE (Mean Absolute Percentage Error): It represents the average of the absolute percentage differences between the predicted values and the actual values. MAPE is a commonly used metric to evaluate forecast accuracy and is particularly useful when comparing accuracy across different datasets or forecast models.
To do the autoarima I did litterally 3 lines.The autoarima does everything I did with prophet automatically, It just need the csv with the data which was going to forsee. The instructions I used are:
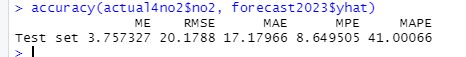

To analyze the data between them, we first wanted to do it with r^2, but we couldn't, therefore we calculated the accuracy and also the autoarima and thus be able to see which one is more exact/effective. As we can see in the two tables the mean error (ME) is lower in the autoarima so we can say that the accuracy in the autoarima si better, however the Root Mean Squared Error(RMSE) is lower in the prophet so in that case its accuracy is better. The mean absolut error(MAE) is more little in the prophet, due to that we can understand that between all the errors it has the lowest one. The mean percentatge error in the autoarima is negative, it mean that the pronosticated value is bigger than the real one, so compared with the prophet one we can say that the prophet has more accuracy.
To sum up, after comparing all the results we can guess that the prophet has more accuracy in forecasting and forseeing the results that will happen in the future. So if you want to forsee the future you should better use the prophet method, although it is slower you should use it
In order to analyze the results I have done a canvas scientific poster , it shows the difference between the real data and the predicted and it also show graphically the evolution of the no2 during the week, month,... and how is done the future prediction algorithm